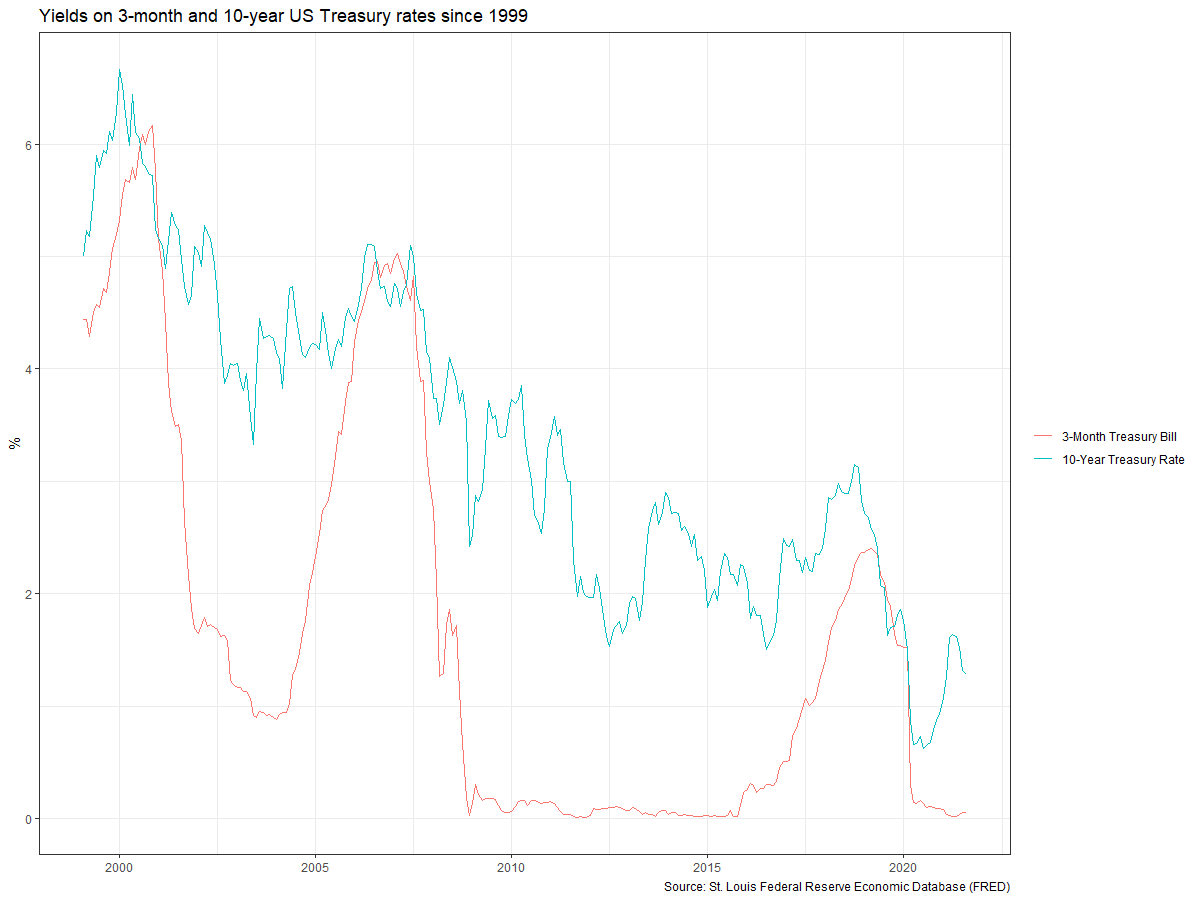
recessions_yc <- yield_curve %>%  # Filter for 3m and 10y maturities and select years from 1999
  filter(maturity %in% c("3m","10y")) %>%
  filter(year(date) %in% c(1999:2021))

# plot the yields on 3-month and 10-year US Treasury rates since 1999
ggplot(recessions_yc, aes(x=date, y=value, colour=duration)) +
geom_line() +
theme_bw() +
theme(legend.title = element_blank()) +
scale_color_manual(values = c("cadetblue3", "pink")) +
labs(
    title = "Yields on 3-month and 10-year US Treasury rates since 1999",
    y="%",
    x="",
    caption="Source: St Louis Federal Reserve Economic Database (FRED)")
